Use cases and and applications of Big Data are an important ingredient in enterprise digitization. Many use cases are time based; understanding Time Series analysis and Time Series Applications are crucial for Big Data Science and enterprises. In this article, we will be discuss our well-known Big 5 Time Series Applications and illuminate examplary applied scenarios.
Time Series event impact analysis
The first Time Series Application is to use Time Series Data to estimate the impact of a certain event.
Imagine trains which run late at a specific time and a railroad which wants to improve this situation and, understanding behavioural patterns of waiting passengers.
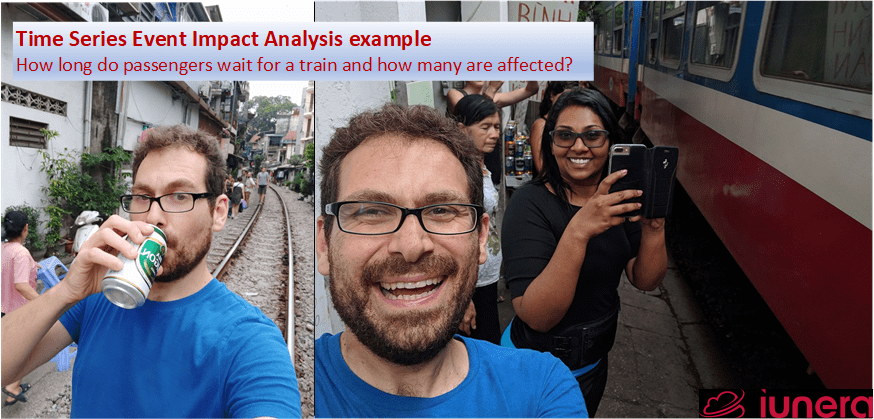
Time Series Analytics Applications can support you to determine how many passengers were affected by late trains on a specific day and how many minutes they had to wait altogether.
With this information, the total time taken by passengers waiting for their ride can be computed.
Now, the data can be aggregated further over different days for different train lines and stops. A railroad can then have information like:
The 12:00 o’clock train from Frankfurt to Berlin has the total amount of 7872 hours and 32 minutes passenger waiting during the last month during weekdays.
These information then can be used for grouping the train lines and to see which train/stops/arrivals are the least appealing for passengers and a focus can be set to improve those trains in the future.
This then may make most passengers happier and satisfied, waiting for their train ride at least. Anyways, as evidenced in the picture above: Waiting for a train can also be fun sometimes.
Operational Monitoring
More complex infrastructures lead to more and subsequent data. Also, business processes and machines get increasingly complex, and this needs to be monitored. Thus, operational monitoring is another prominent Time Series Application.
Operational monitoring is about collecting metrics from IT processes and business processes and then having insights into how values change over time.

There are so many different metrics which need to be checked frequently, and this makes it hard to maintain an overview with traditional approaches.
In addition, sometimes metrics get out of bounds and then they flip in back into a normal pattern. Without collecting the metrics over time and having them being able to analyze them will become extremely challenging to maintain an overview.
For instance, DevOps are getting more and more metric based. A Microservice based infrastructure has plenty of service metrics for each Microservice. It is impossible to know all metrics of a Microservice and its change over time. With a Time Series Database it is easier to monitor and consolidate all Microservice metrics.
Another example for the same Time Series Application of operational monitoring is social media activity control. Imagine a social media team of a political party monitors the pattern activity on a daily basis of how their party is mentioned. Suppose the politician of the said party conducts himself inappropriately in some manner, the mentioning of the party can send an up-rise and a catastrophic storm might erupt.
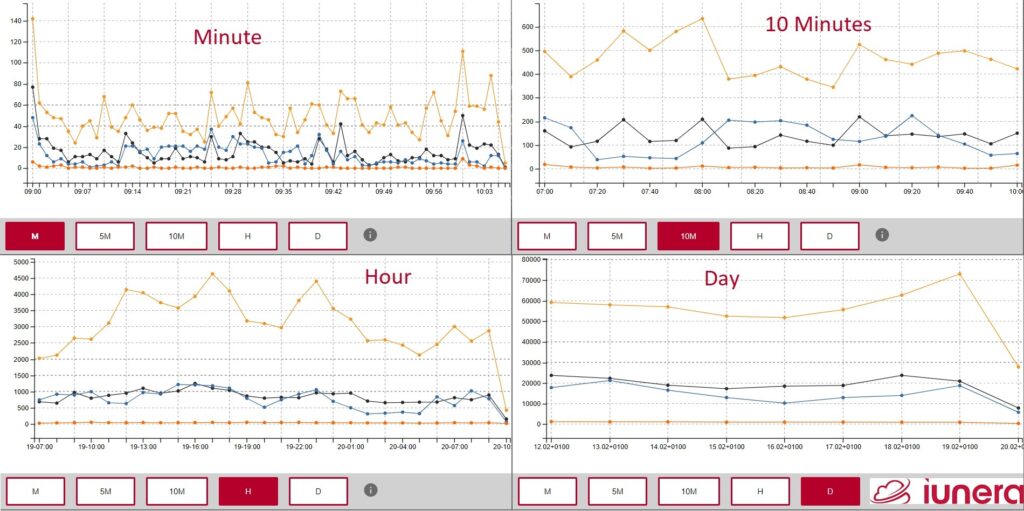
Another scenario also could be that that the up-rise simmers down normally and no intervention to cool down things of the party is needed; therefore, it is important to track the mentions in different time granularities to monitor how things go.
The following graphic shows different granularities of Hashtag mentions.
More information about the use case to analyze political parties can be found in our articles about the Twitter analysis of the last German election – I excuse myself to our English readers, it is in German 🙁
Statistic investigations
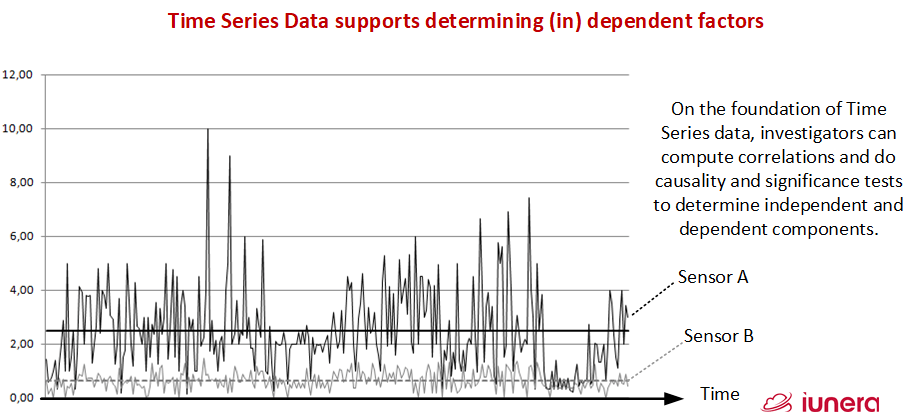
With Time Series Data, the values of different variables over time can be studied. The variable behavior over time can then determine correlations. Such correlations can then be investigated to study causality and statistical significance and more.
Imagine a temperature, energy consumption sensors and others in a machine. The goal of a project and Time Series Application is to do predictive maintenance and what is in question is: which of the sensors, or if it is a combination of them, can forecast a machine failure.
It can be a first question if the readings of the sensors are statistically independent variables or are the independent parts of the readings.
As a first test, correlations can be computed, significance or factor analysis can be done and provide first insights about the dependencies of the readings.
The following picture shows two different sensor readings. Detailed analysis of the time series can bring insights if the values are dependent/independent.
Anomaly detection and alerting
Imagine the same IoT scenario like before, where you get plenty of regular sensor data where you want to determine irregularities. Here, sensor data like temperature might change over the day and it will get very hard to find out irregularities by hand.
In addition, a sensor might emit the temperature readings quite often and you need to arrange and reduce the data by hour average readings to avoid the recognition of small variations.
Hence, one can store the Time Series Data in a Time Series Database and prepare the training of an anomaly detection algorithm from there to then check the new values against the trained algorithm.
The following graphic visualizes a simplified case. There, we see two different sensor readings throughout one day. Energy and temperature stays in the range of A most of the time, but on some occasions the energy readings spikes.
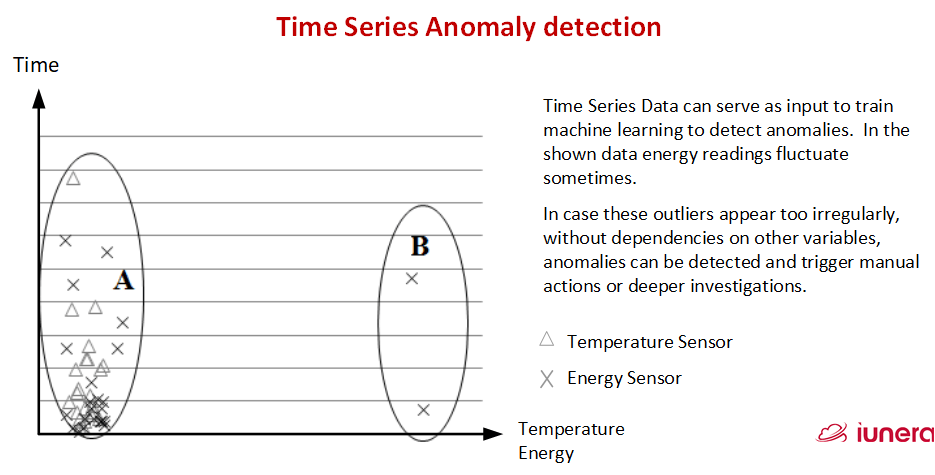
The reason for such spikes might be special operations of the machine, i.e., having an on/off application, but it could also be a malfunction or an indicator that something might breakout soon.
This time series of the sensors would contain many more days of machine operation and the anomaly detection algorithm will learn if the model of energy readings in cluster B are unusual or not (ordinary or extraordinary readings).
Once there is enough data, the new readings are fed into the trained model and if the deviation is too far away from the learned patterns an alert can be generated. This alert can then lead to deeper investigations of the incident.
Machine learning and forecasting
In a similar way to the previously mentioned correlation investigation, one can use Time Series Data to train forecasting algorithms. Historic values and associated changes thereby serve as foundation to find similar situations to predict the future.
For example, if you have a dataset with different indicators and train machine learning algorithms to predict the next value in a sequence. Often, you would use aTime Series Database to query for the right time buckets and to extract the data that you use to train the artificial intelligence for forecasting.
In the following video, you see how Twitter data can be used together with exchange rates to predict future pricing of crypto currencies. The videos finally describes the challenges and findings in order to carry out this forecasting.
Sum-up FAQ
What are the Big 5 Time Series Applications
– Time Series event impact analysis
– Operational Monitoring
– Statistics: E.g. Correlation, causation investigations and factor analysis
– Anomaly detection and alerting
– Machine learning based forecasting
What is an example for Time Series event impact analysis?
Why is operational monitoring an important use case in today's landscape?
Because there are plenty of Big Data Services and Mircorservices running in the background. Those need to be monitored consequently for malfunctions and irregularities.
What are examples for statistic investigations of Time Series Data?
– Correlation analysis
– Factor analytis
How are anomaly detection and alerting related?
Conclusions
There are different use cases in form of Time Series Data Applications. We presented 5 very prominent examples of Time Series Applications.
First, Time Series event impact analysis helps to determine the implications of an event in time. A good example is the total amoung of passenger waiting time for train delays.
Second, operational monitoring helps to control technical processes such as landscape behaviour or social media activity.
Third, statistics investigations help to dtemerine and verify correlations and independent variables.
Fourth, anomaly detection helps to reveal irregularities automatically and to raise alerts.
Fifth, Machine learning based forecasting allows forecasts of future events with a certain likelyhood. A typical example would be future prices of assets.
In reality, Data Scientists and Big Data Engineers need to conider additional factors Time Series applications are developed. For instance, one needs to to consider Concept Drifts and other facts that were not discussed in this article.
Therefore, enterprises need to investigate the effort and obstaces of the different Time Series Applications and then compare them to their value contribution and available skillset.
All in all, this article shows that the presented Time Series Applications offer plenty of enterprise value and can be used to advance non IT specific enterprises on the roads towards digitization.
The concrete value for a specific enterprise and challenges have then to be determined based on the concrete instance.
Are you looking for ways to get the best out of your data?
If yes, then let us help you use your data.

